In today’s world, where information has become more valuable than oil, businesses have realized that they can no longer rely solely on data from their own sources (databases, information systems, and applications). To better understand market needs, they are turning to external data sources such as social networks. The specificity of these sources is that they contain large amounts of data, most of which will not be utilized in the business process. With the increase in the available amount of data and the development of geolocation technologies, a new concept has emerged: geodata, which refers to data that contains information about geographical location stored in a format that allows use in other systems such as analytical software. Geodata can cover the entire spectrum of business: from customers, business partners to departments of your company or anything else in its business network.
Geospatial Analysis
According to the research ‘Business Decision-Making – The Use of Geospatial Data’ conducted by Michael Erskine and colleagues, more than 75 percent of the data that a company possesses may contain geodata, and they are used in more than 80 percent of business decisions. The problem is that managers, analysts, and employees are not even aware of the existence of this geodata, so they cannot include it in decision-making. In business, we often ask ‘who, what, when, and how’. Business intelligence answers these questions, but the question ‘where’ often remains unanswered until the end. Therefore, it is necessary to apply geospatial analysis tools to extract the information needed for decision-making. Such analysis is applied in many industries and areas of life.
>>>Balen: The ICT sector can employ up to 50,000 people according to export growth and opportunities
When you look at the weather forecast, it shows us the results of geospatial analysis in combination with climatological, meteorological, and hydrographic data (sometimes even with folk proverbs). It is also applied in agriculture when selecting planting locations, analyzing soil composition, and precipitation history; in the military when planning military maneuvers, supply operations, and logistics; in public administration, healthcare – for example, to detect outbreaks of certain diseases, in controlling infectious diseases, discovering the causes of arsenic poisoning, and so on. While various statistical methods such as spatial autocorrelation, stratified heterogeneity, and others are primarily used in geospatial analysis, which would require a business person to have completed a statistics course at PMF to utilize them, there is also the method of geovisualization.
The Most Popular Maps
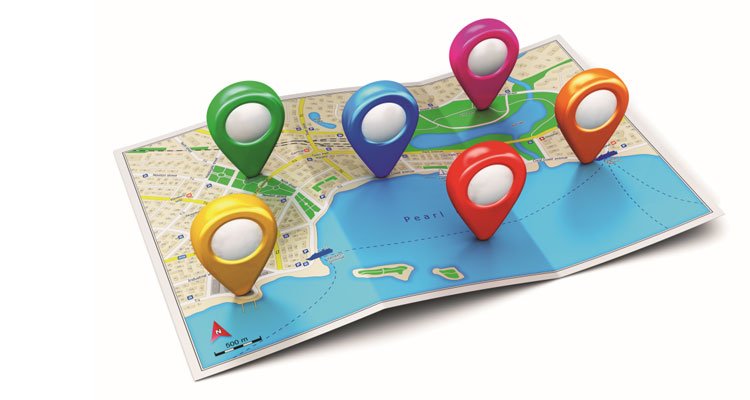
Geovisualization is the analysis of geodata through interactive visualization, utilizing the brain’s natural ability to find patterns. While our ancestors used it to spot wild beasts or prey, younger generations used it to find where Jura is hidden in a picture, and business users use it to gain new insights from their data. Pattern recognition is one of the most important areas of artificial intelligence development, such as IBM’s Watson, which can find connections between data that business people have not noticed in a sea of data. To arrive at new insights more quickly, geovisualization projects business data onto various types of maps. The most popular types of maps are network maps (showing network equipment in a company’s network system, tram line maps), flow maps (showing trade exchanges between countries, branches…), symbol maps (weather forecasts), and choropleth maps (showing areas on a map in different colors). In practice, combinations of different representations on one map are most often used. This has significant advantages over standard visualization methods and especially over pivot tables and lists because it is easier for our brain to find patterns displayed on a map than buried in thousands of rows of pivot tables.