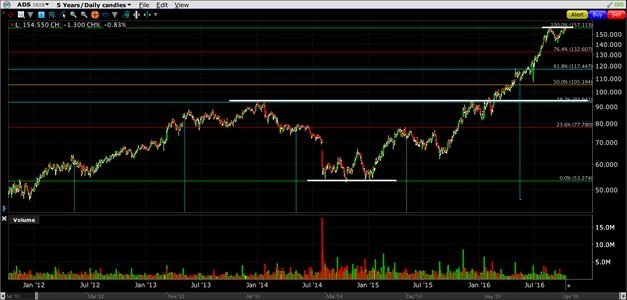
The stock of Adidas AG has been rising relentlessly in recent years. In just the last 12 months, the price has increased significantly by 107%. Can this growth continue?
The company Adidas AG, along with its subsidiaries, designs, develops, manufactures, and sells clothing, footwear, and other products for professional athletes and recreational users worldwide. It operates through 13 segments; Western Europe, North America, China, Russia, Latin America, Japan, the Middle East, South Korea, Southeast Asia, and the Pacific, TaylorMade-Adidas Golf, Reebok-CCM hockey, and running. The company distributes its products wholesale, through retail, and online, under the brands Adidas and Reebok. The offering includes footwear, apparel, and products such as sports bags, balls, and other equipment necessary for sports. The company is also involved in the operations of Y-3 and Porsche Design Sport. As of December 31, 2015, the company operates 2,772 stores, of which 1,484 are under the Adidas brand, 366 under the Reebok brand, and 872 outlets. The company was known as Adidas-Salomon AG and changed its name to Adidas AG in June 2006. The company Adidas AG was founded in 1920 and is headquartered in Herzogenaurach, Germany.
The current stock price of Adidas AG [ETR:ADS] is 154.25 EUR, with a market capitalization of 32.67 billion EUR. The price has ranged from 74.19 EUR, which marked the annual low on October 9, 2015, to a peak of 157.45 EUR reached on August 18 and September 29, 2016. The stock is listed in the Frankfurt Stock Exchange index – DAX 30, which includes the 30 largest companies from Germany.
The long-term trend is upward. The medium-term trend is horizontal, while the short-term trend is upward. The RSI (14) indicator, which signals overbought/oversold conditions of the stock, is in the neutral zone with a value of 56.35. The main moving averages (MA) are at the following price levels: SMA20 at 152.34 EUR, SMA50 at 151.55 EUR, and SMA200 at a price of 118.40 EUR. The current price is above all significant MAs, indicating a strong upward trend, and faster MAs are above slower ones.
The year-to-date (YTD) return is positive at +64.39%. If we look at the last month, the price has increased by +5.32%, while over 6 months, the growth was +48.22%, and on an annual basis, the return is positive at a significant +106.95%. Let’s see what the charts say.
Chart 1 – Daily Chart 5Y – (ETR:ADS)
Source: OptimTrader trading platform
Chart 1 – Daily Chart 1Y – (ETR:ADS)
Source: OptimTrader trading platform
Pattern: The stock price over the last 12 months is in an upward trend. The strong upward trend (Chart 1) was temporarily halted at the price level of 157.45 EUR, which is a level that has been tested twice, forming a double top that could hint at a trend change. Given that the continuation of growth was marked by a triple bottom from early 2015, this pattern has proven significant for this stock. The position of the RSI (Chart 2) is also significant, as it did not follow the price increase in an attempt to break the level of 157.45 EUR but showed weakness and the first alarm for a trend change. The first support levels in case of a price drop are S1 at a price of 141.60, S2 at a price of 119.35, and S3 at a price of 95.25, which may also represent price targets in case of activating sell (short) positions.
Possible entry into position: An ideal entry into a sell position would be at the level of the double top with minimal risk above that line at around 158.95 EUR.
Possible exit from position: The first price target is at S1 at a price of around 142 EUR.
Money Management: 1:10
For OptimTrader Ivan Stojanović, Head of Croatian Market at CM-Equity AG (OptimTrader)
The analysis is for informational and educational purposes and should not be construed as a recommendation to buy/sell stocks. By reading the analysis, you accept the Disclaimer.
DISCLAIMER:
The content of the article does not constitute investment advice nor should it be interpreted as a recommendation for trading in the capital market and other financial markets. The author disclaims any responsibility and is exempt from any potential loss incurred from trading based on this analysis. The ideas expressed in this analysis are solely the opinion of the Author and not the company in which they work. Everything presented in the article is written solely for educational purposes. Before starting to trade, it is important to understand the risks associated with trading financial instruments and financial products. Trading in stocks, ETFs, futures contracts, currencies (FX), CFDs, options, leveraged financial instruments, and other financial instruments involves high risk, so there is a possibility of losing the entire deposit and more. You and only you are responsible for your investment decisions. The only recommendation we give is to consult with a licensed investment advisor.