
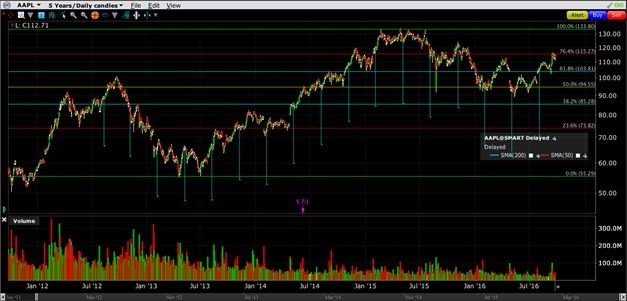
Let us examine what to expect from Apple stock in the coming period. There is probably no person in the world who has not heard of this company and its globally successful products and services. The product portfolio includes iPhone – smartphones, iPad – tablets, and Mac – computers. The service portfolio includes iLife – software based on a digital lifestyle for users, iWork – a digital productivity suite that helps users create, present, and publish documents, presentations, and other programs essential for business operations. It also offers Apple TV, which connects directly with the user and provides streaming services for desired content that the user frequently watches. They also offer the Apple Watch, which is connected to the user’s iPhone, along with many other products and services. They have a strong desire to create a car, and whether they will succeed will be revealed in the near future. Apple Inc. was founded in 1977 and is headquartered in Cupertino, California.
How the launch and expectations of the new iPhone 7 model have affected the stock price will be examined in the analysis. The strong price increase in the last two weeks was supported by the launch of the new iPhone 7 model, and it can be seen (Chart 2) that the stock price rose from $102.53 to $116.18 in just one week.

The current stock price of Apple Inc. [NASD:AAPL] is $112.71, with a market capitalization of $607.33 billion. The price has ranged from $88.99 to $121.23 over the past year. The stock is included in the DJIA and S&P 500 indices.
The long-term trend is upward. The medium-term trend is horizontal while the short-term trend is upward. The RSI (14) indicator, which signals overbought/oversold conditions of the stock, is in the neutral zone with a value of 59.98 and is moving towards the overbought area. The main moving averages (MA) have the following values relative to the price: SMA20: +3.23%, SMA50: +5.95%, SMA200: +11.40%.
The year-to-date (YTD) return is positive at +8.90%. If we look at the last month, the price has increased by +4.33%, while over 6 months the increase was +8.39%, and on an annual basis, the return is positive at +0.10%. Let us see what the charts say.
Chart 1 – Daily Chart 5Y – (NASD:AAPL)

Chart 2 – Daily Chart 2Y – (NASD:AAPL)

Pattern: Since the bottom formed in May of this year, an upward channel has been established within which the price moves between the upper resistance line of the channel and the lower support line of the channel, with higher peaks and higher lows. The stock price is above significant moving averages (MA), which is evidence of a strong upward trend, especially since the 200-period MA was broken, which has proven to be a reliable trend direction (Chart 2) and a significant resistance level the previous two times, now acting as a support level. The faster 20-day MA is above the slower 50-day MA, which supports the upward trend. The price has currently bounced off the Fibonacci level of 76.4% (Chart 1), which can be interpreted as a significant level, with the possibility of another test of the 61.8% level, which coincides with the lower line of the upward channel (Chart 1).


